Guides
Which carpet cleaning services carry the best margin
The most profitable carpet cleaning services are the ones your own records say they are. This is the audit that produces the ranking from your job history.
What to take away
- Profitability by service is a property of your route, your equipment and your technicians, so it cannot be ranked nationally for you.
- The audit below produces the ranking from records you already have, or already should have.
- The measure that separates services is contribution per productive hour, not price per job and not gross revenue.
- A service that produces callbacks is paying you twice for one job and charging you twice for it in labor.
Why a national ranking cannot answer this
Two cleaners in the same city can have opposite answers. One runs a truck-mount through a dense suburb where upholstery add-ons attach to most jobs. The other runs a portable through mid-rise condos where setup eats the margin upholstery would have earned. Same service list, different ranking.
What travels between businesses is the method for finding out. The menu design that the ranking then feeds into is the subject of the services and packages guide.
What to pull from your own records
You need six fields per completed job for the last full quarter. If your records do not hold them, this is also a specification for what to start recording.
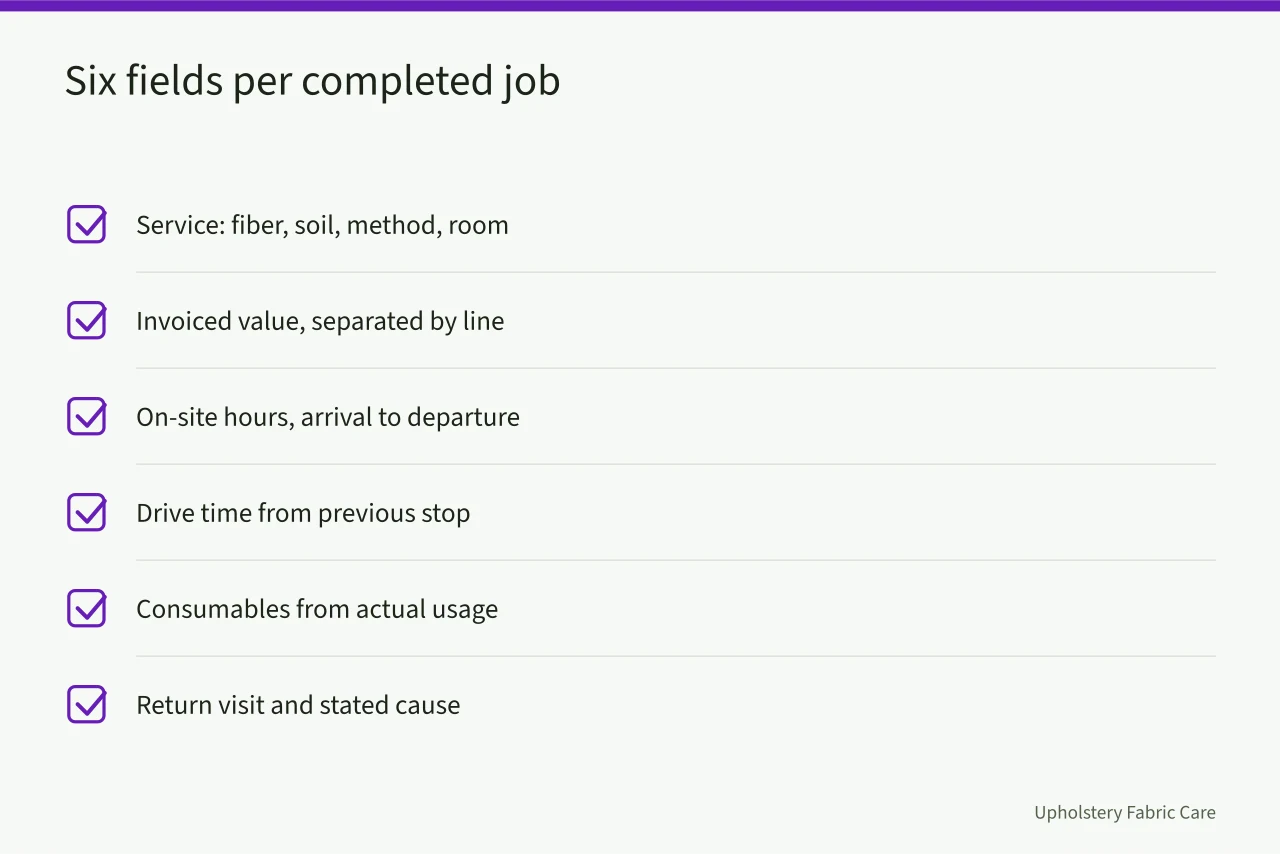
- Service performed, using the four fields of fiber, soil condition, method and room rather than the menu name.
- Invoiced value of that service line, separated from other lines on the same invoice.
- On-site hours, from arrival to departure.
- Drive time to that job from the previous stop.
- Consumables attributable to the job, taken from usage rather than from an estimate.
- Whether a return visit occurred, and its stated cause.
Federal guidance on the records a small business keeps is in the IRS small business recordkeeping guidance, and these six fields sit inside it.
Field 2 is where most owners stop, because their invoices bundle. Unbundling one quarter by hand is tedious and is the whole point of the exercise.
The measure that separates the services
Rank on contribution per productive hour, written as variables you fill in.
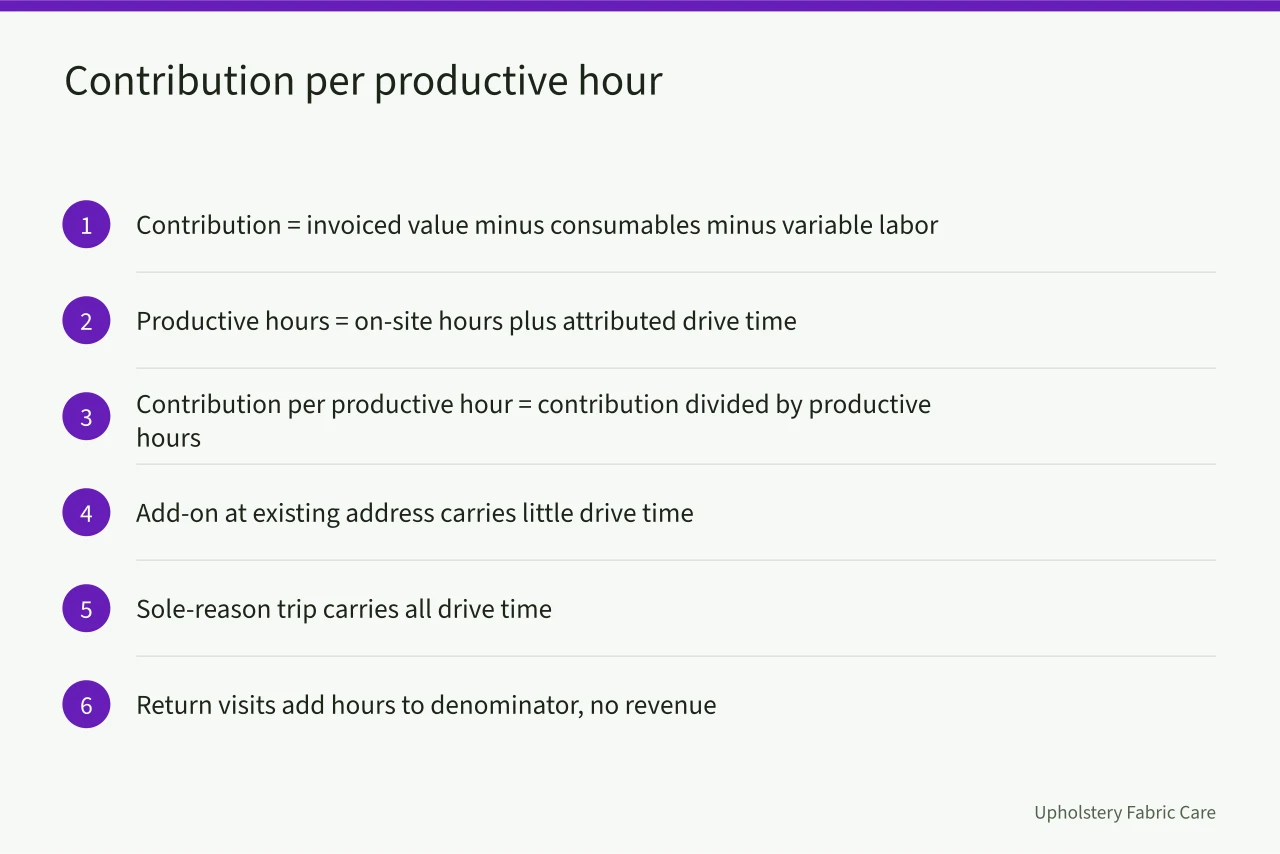
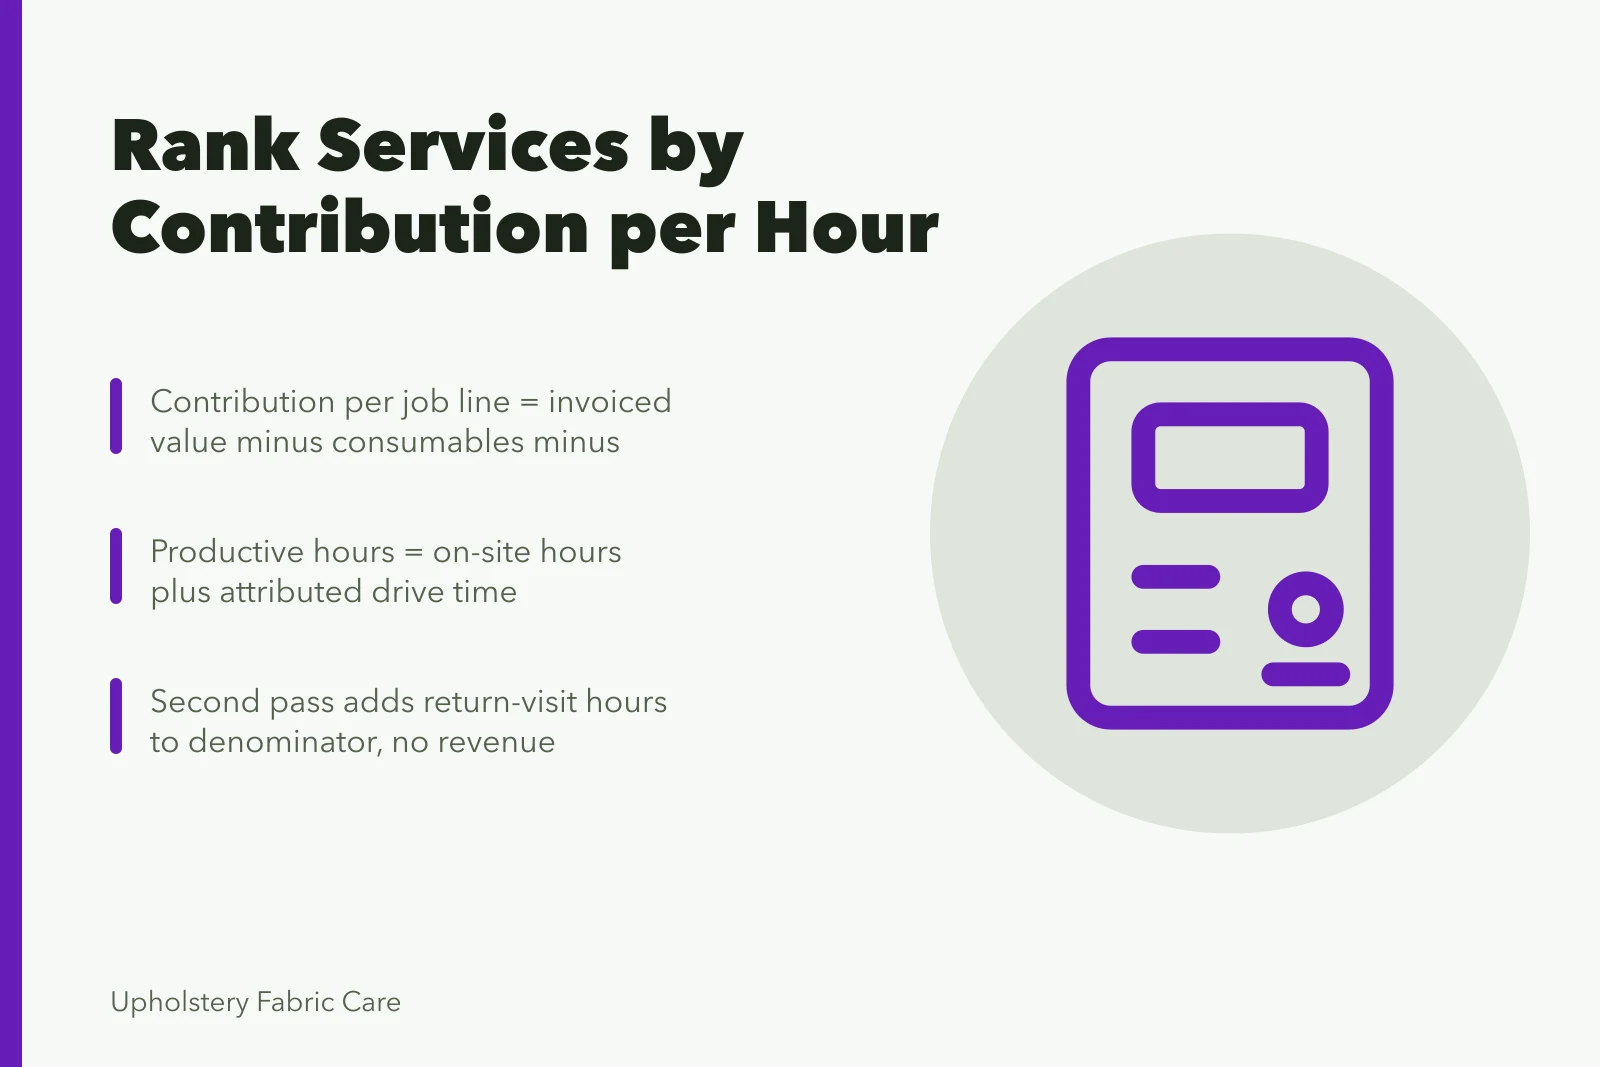
- contribution per job line = invoiced value minus consumables minus variable labor for that line
- productive hours = on-site hours plus attributed drive time
- contribution per productive hour = contribution per job line divided by productive hours
Short high-value services look excellent until drive time is attributed to them. Long low-value services can outperform them when they attach to a job you were already at. And any service with a return-visit rate above zero has to carry the second visit's hours in the denominator, which is where the ranking usually changes.
Attribute drive time honestly. An add-on at an address you were already visiting carries little or none. A service that is the only reason for the trip carries all of it. That distinction reorders most menus.
Working through one month of jobs
Take the most recent complete month rather than the quarter, so the exercise finishes.
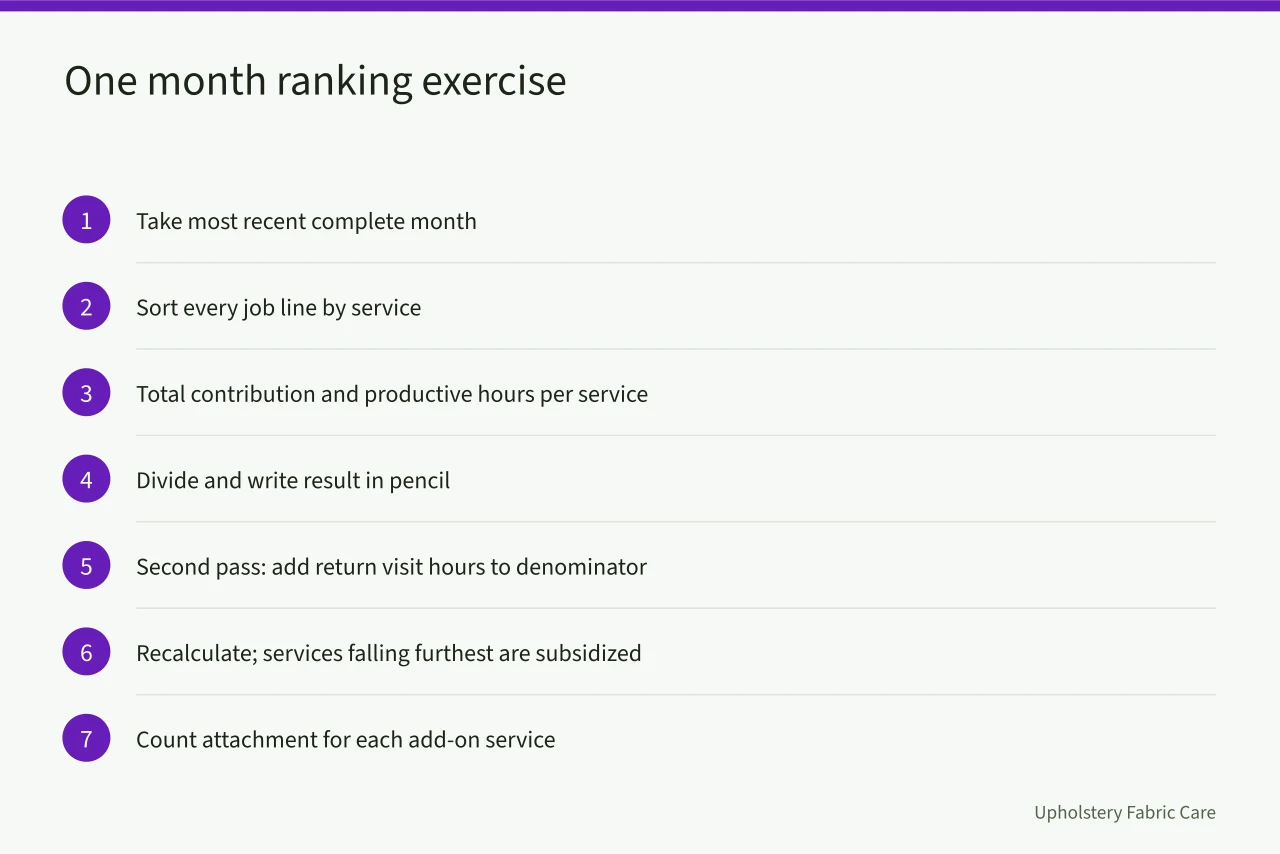
Sort every job line by service. For each service, total the contribution and total the productive hours, then divide. Write the result next to the service on your menu, in pencil.
Now the second pass. For each service, count the return visits and add their hours to the denominator without adding any revenue to the numerator. Recalculate. The services that fall furthest between the first and second pass are the ones your business is currently subsidizing.
Then look at attachment. For each add-on service, count how often it was sold alongside a primary job rather than alone. An add-on with high attachment and moderate contribution frequently beats a standalone service with high contribution and low frequency, because it consumes no additional trip.
The staffing consequences of the result belong with the hiring and training guide, since a service that only your best technician can deliver is capacity-limited whatever its contribution rate says.
Services that look profitable until you include the callback
Four patterns recur across cleaning businesses, and each is invisible on a revenue report.
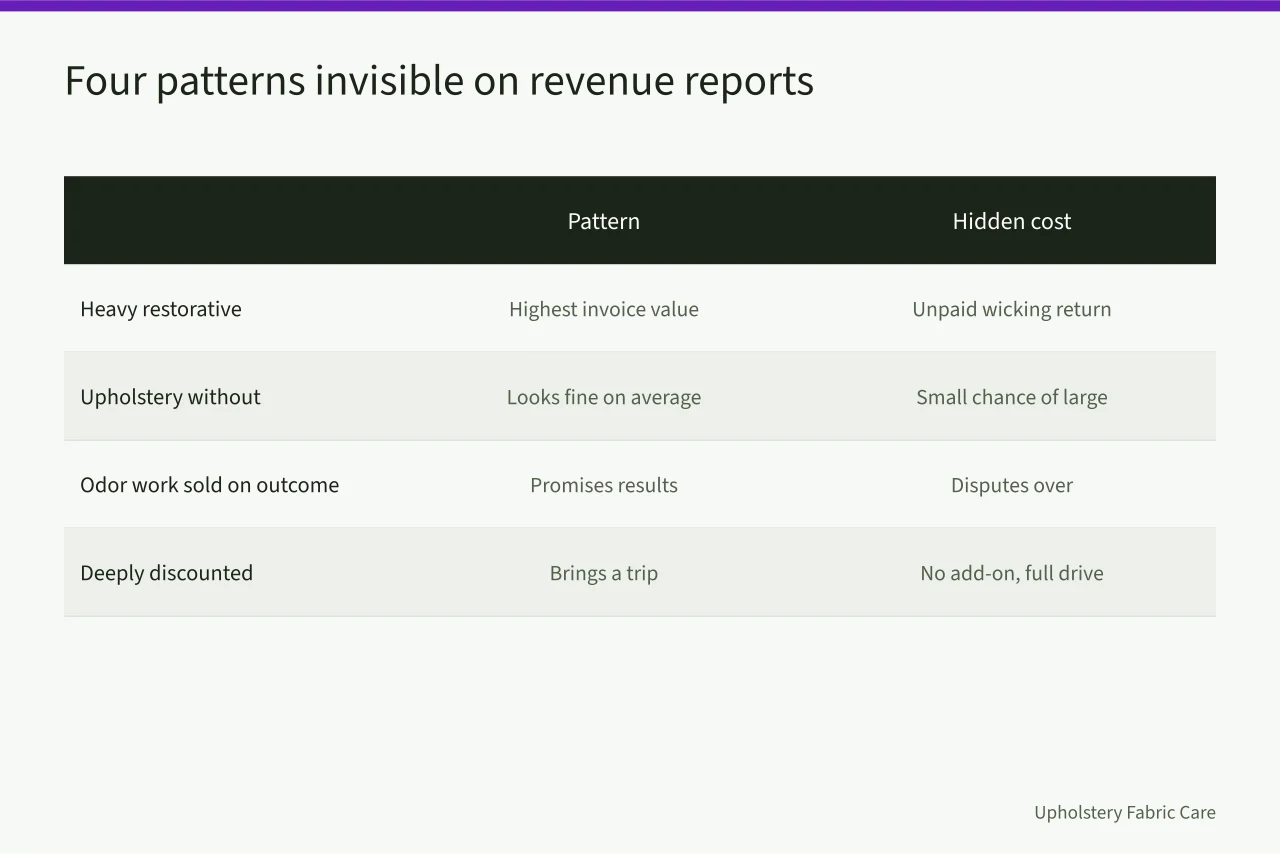
Heavy restorative residential work shows the highest invoice value and a return-visit rate driven by wicking, where soil or dye travels back up the fiber as it dries. The second visit is unpaid.
Upholstery work quoted without a recorded cleaning code or a colorfastness test carries a small chance of a very large loss. Ranked on average it looks fine. Ranked with the tail included it may not be.
Odor work sold on an outcome rather than on a described process produces disputes about whether the outcome was achieved. Describe the work performed and avoid promising results you cannot document.
Deeply discounted introductory services attach poorly. They bring a trip with no add-on, which loads the whole drive time onto a low-contribution line. Marketing choices that produce this pattern are discussed in the marketing and growth guide.
Production rate is a machine property as much as a technician one. The equipment and setup guide sets the floor under all four patterns.
What you may say about any of them in advertising is constrained by the substantiation obligation in the FTC advertising guidance for small business. Your state may constrain the trade further, which the licensing and compliance guide covers.
Common questions
What if my records do not have on-site hours?
Start recording them this week and run the audit next quarter. A rough version using scheduled durations is better than nothing, provided you do not act on small differences.
Should I drop the lowest ranked service?
Not automatically. Ask whether it is low because it is mispriced, mis-scoped, or beyond current capability. Two of those are fixable, and dropping a service customers use to find you can cost more than it saves.
How often should the audit be repeated?
Once a quarter is enough for most one and two truck operations. Repeat it sooner after any change to equipment, territory or technician mix, because all three move the answer.
Does contribution per hour work for commercial route work?
It does, with one adjustment. Measure route work per visit and per contract, because the contribution comes from density across the route. Attribute drive time across the route rather than to the first stop.